Spatial distribution of violent crime in Bogotá D.C.
Descriptive analysis of spatial distribution of violent crimes by socioeconomic development
During 2023 worked with Professor Daniel Mejía on a descriptive analysis of how crime types in Bogotá D.C., the capital city of Colombia, affect disproportionately certain systematically similar sectors in the city in comparison to others. You can see a more detailed description of the project here. We found that under different metrics of sociodemographic “development” level violent crimes like homicide, domestic violence, and sexual crimes tend to affect impoverished or disadvantaged areas, whereas crimes against private property like various types of theft are more common in areas with higher sociodemographic development. I used three levels of spatial aggregation ranging from the larger to smaller areas: UPZs, cadastral sectors and city blocks (called manzanas in Colombia), meaning 114, 1171 and 43956 polygons respectively.
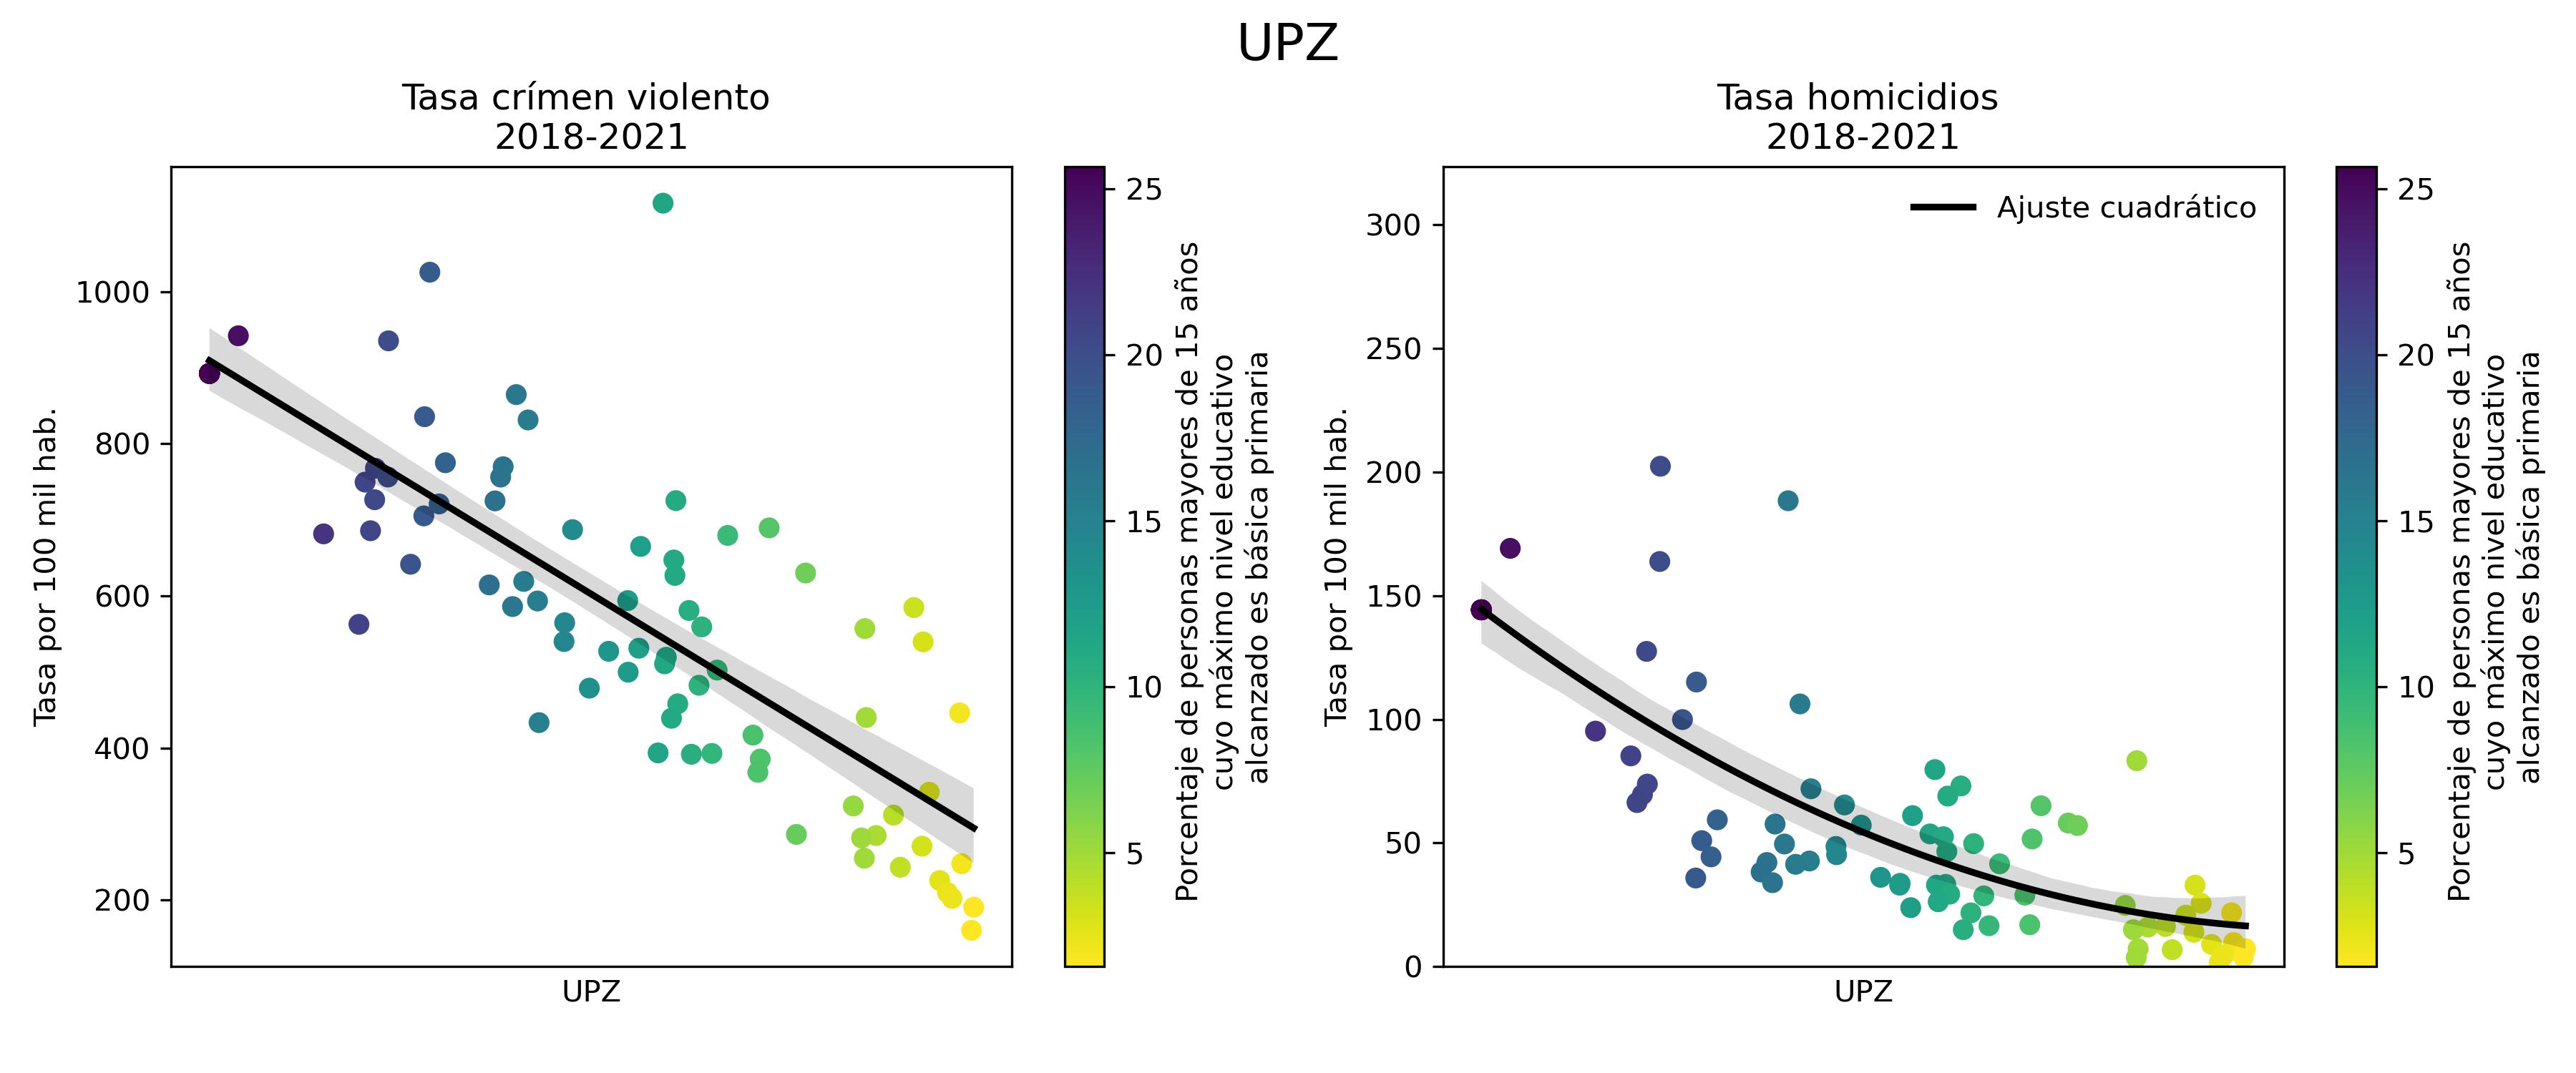
The Unidades de Planificación Zonal or UPZ are planning units designated by the 2016 Land Use Plan (Plan de Ordenamiento Territorial or POT in Spanish). Figure 1 shows that violent crimes are more prevalent in UPZs with a higher proportion of people whose maximum education level is primary education, and this same relationship holds for the isolated homicide rate.

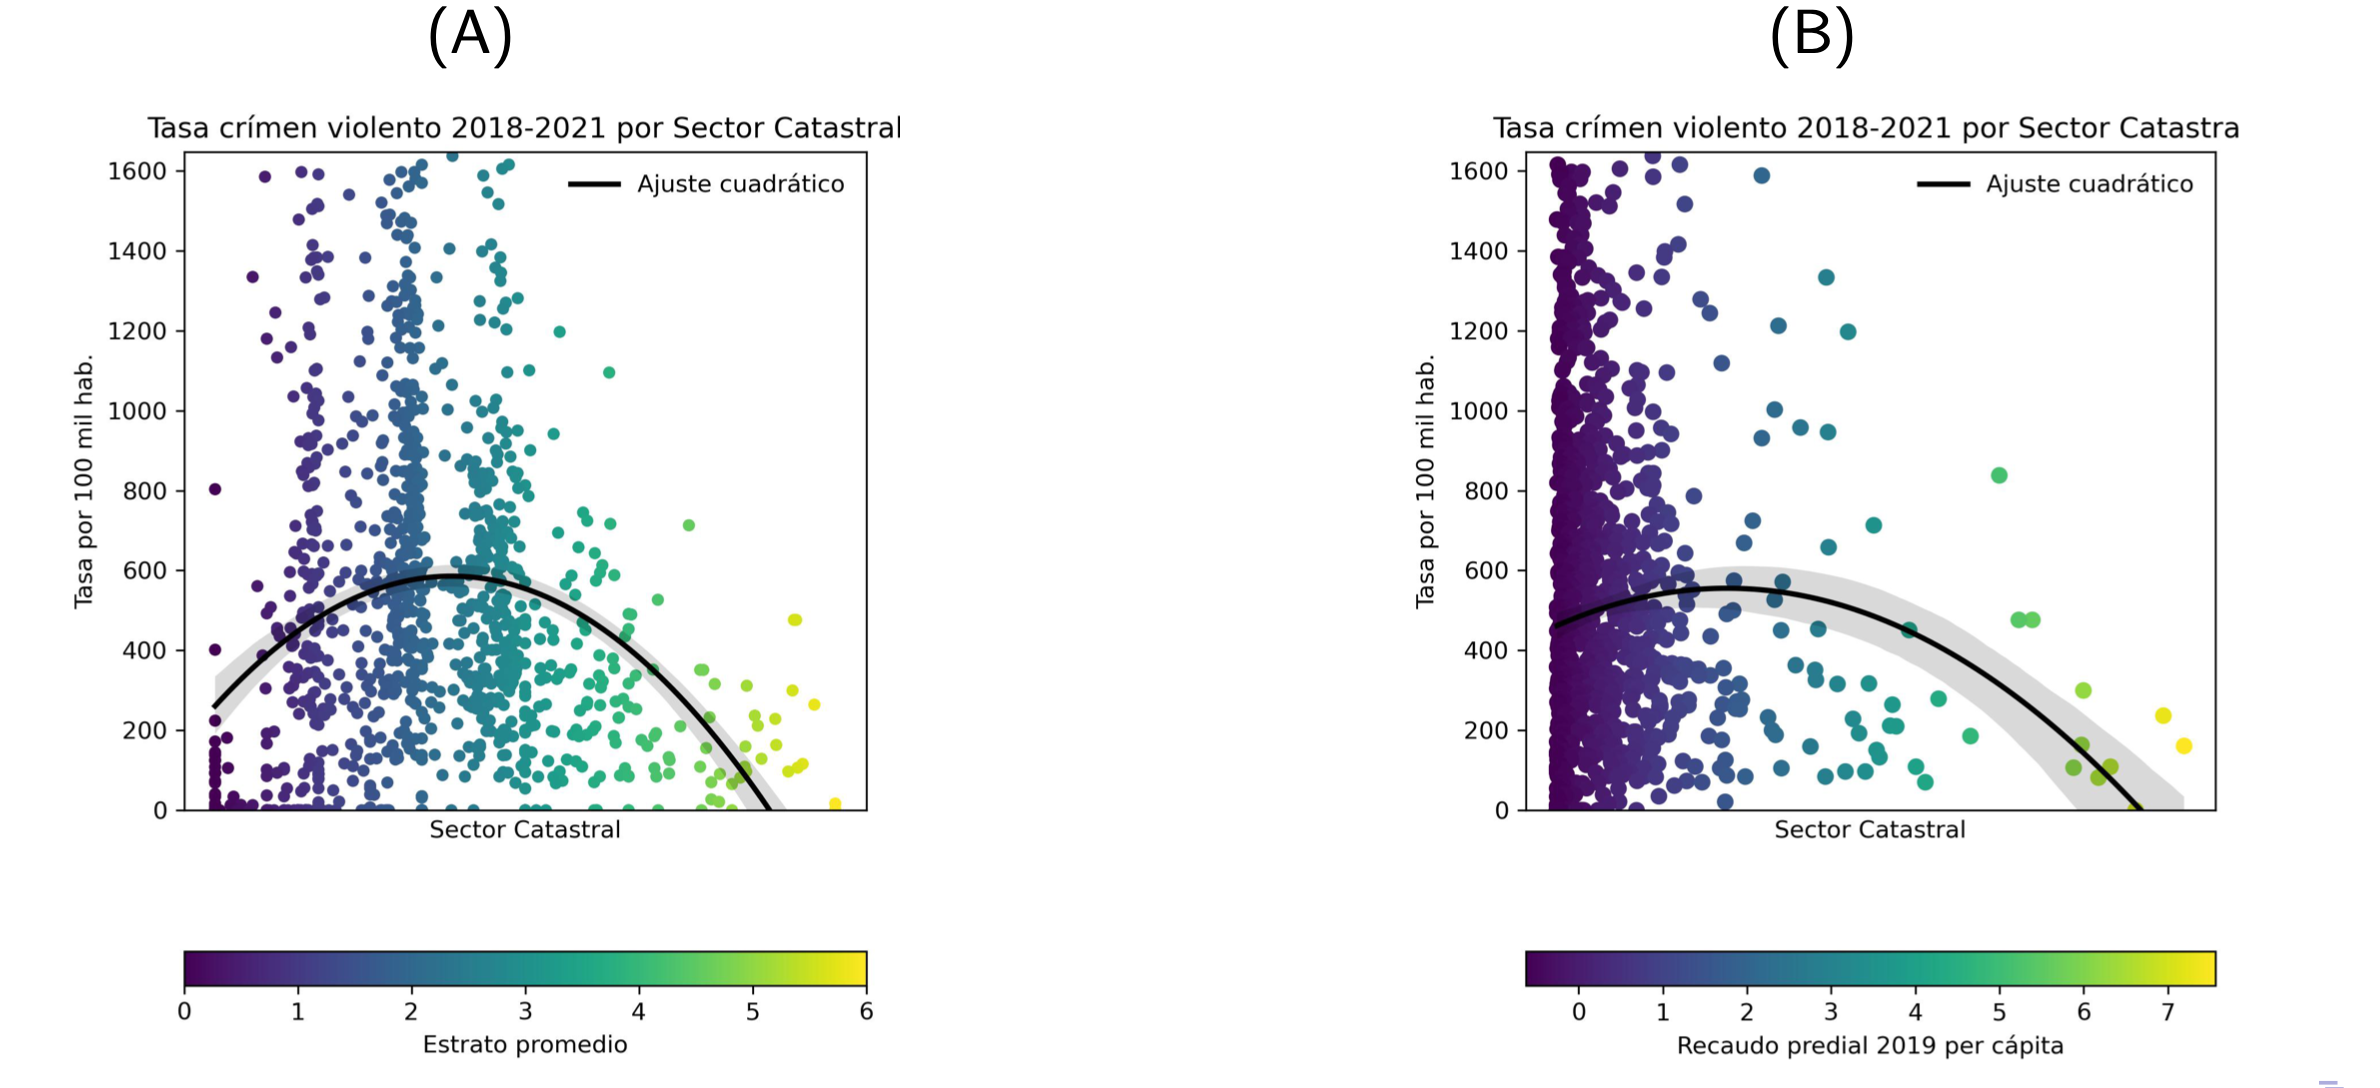
At the cadastral sector level the relationship between violent crime rate and 2019 per capita revenue seems to reflect a quadratic relationship, also present when compared to the mean socioeconomic stratum of the sector (Figures 2B and 2A respectively).

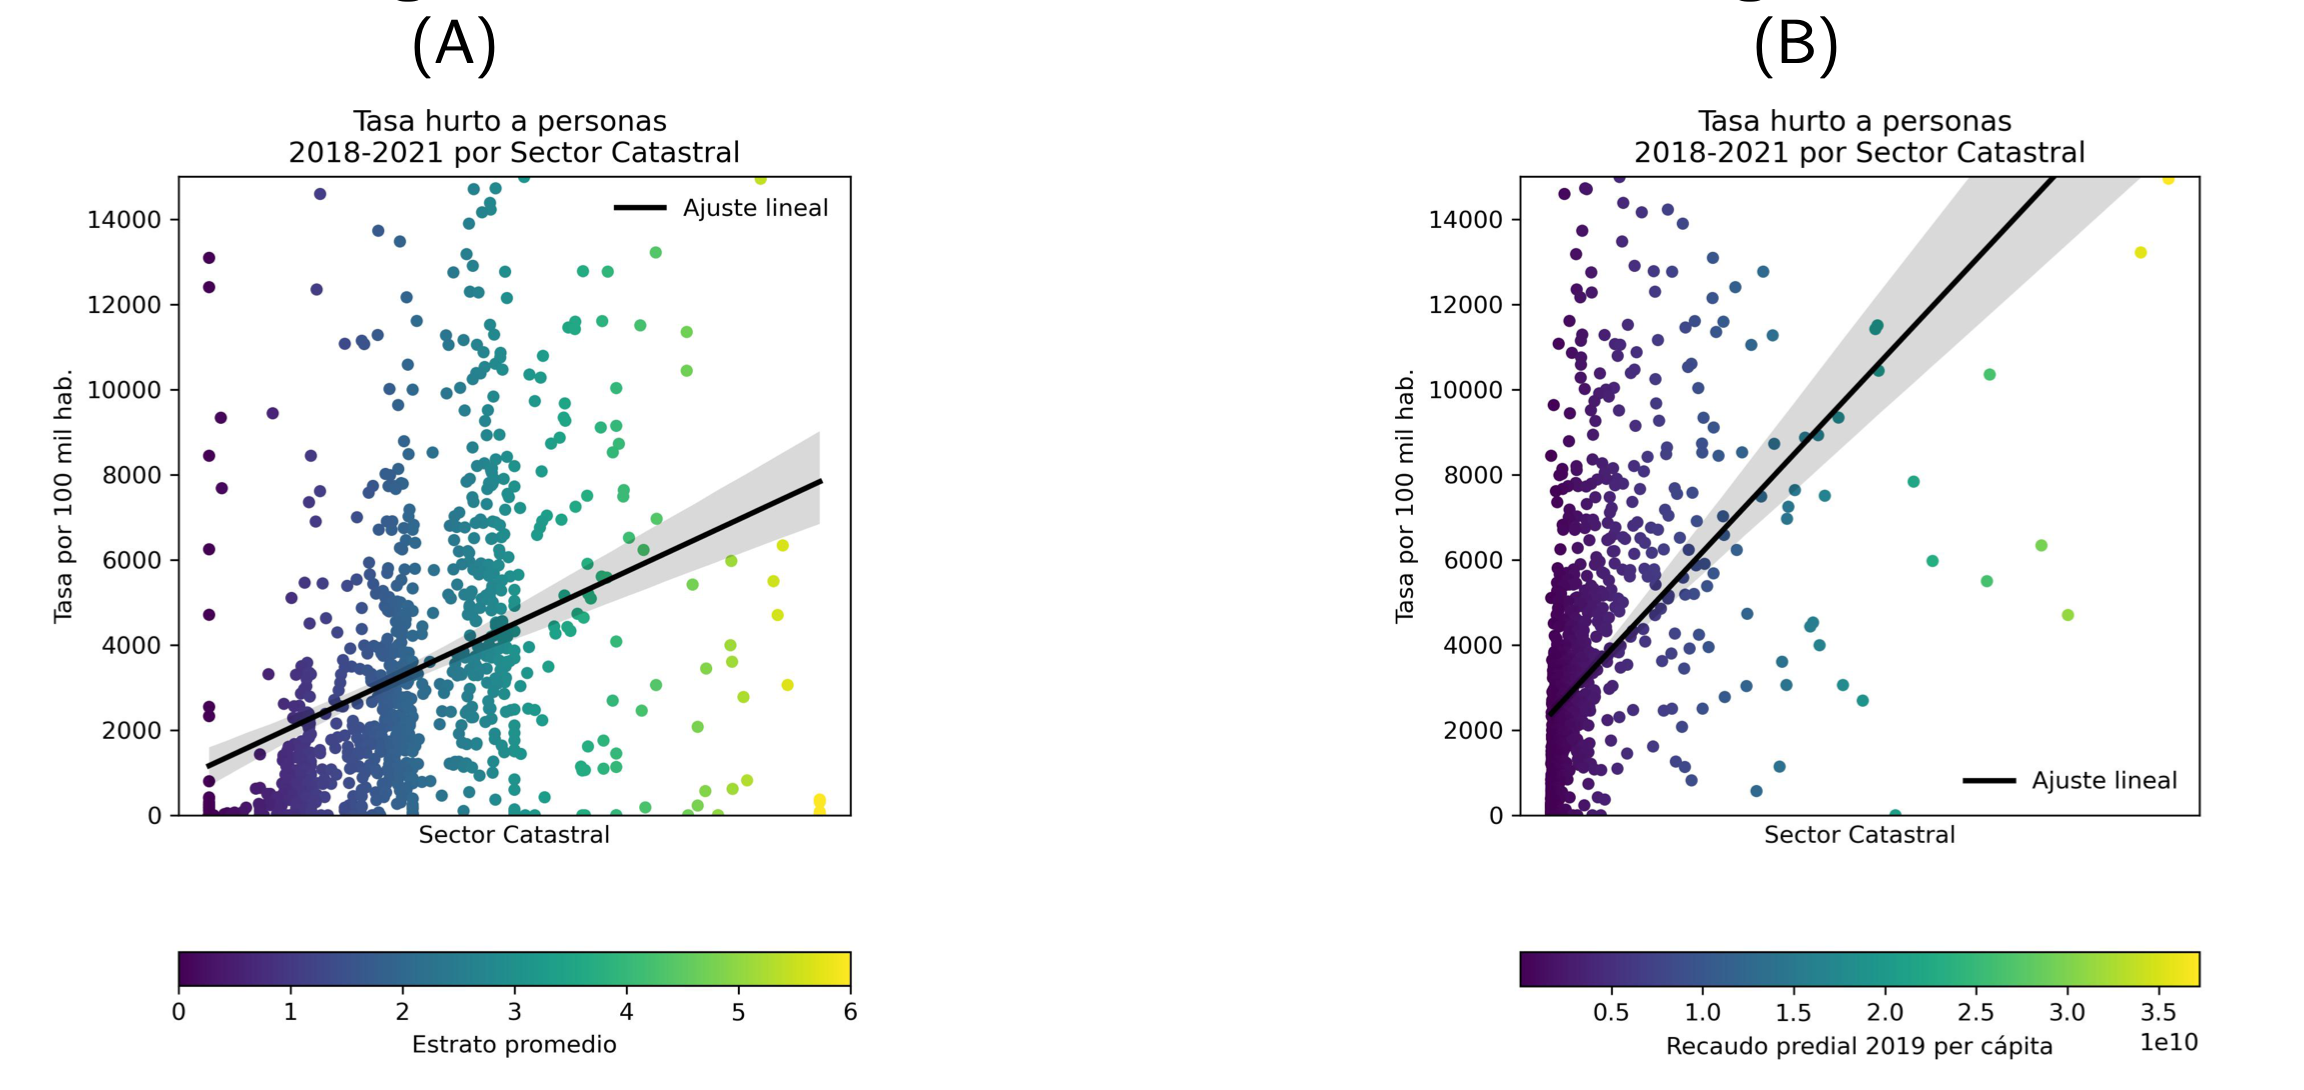
The positive correlation between robbery rate and socioeconomic level is present both when proxied by mean economic stratum as well as per capita 2019 property tax revenue (Figure 3A and 3B).

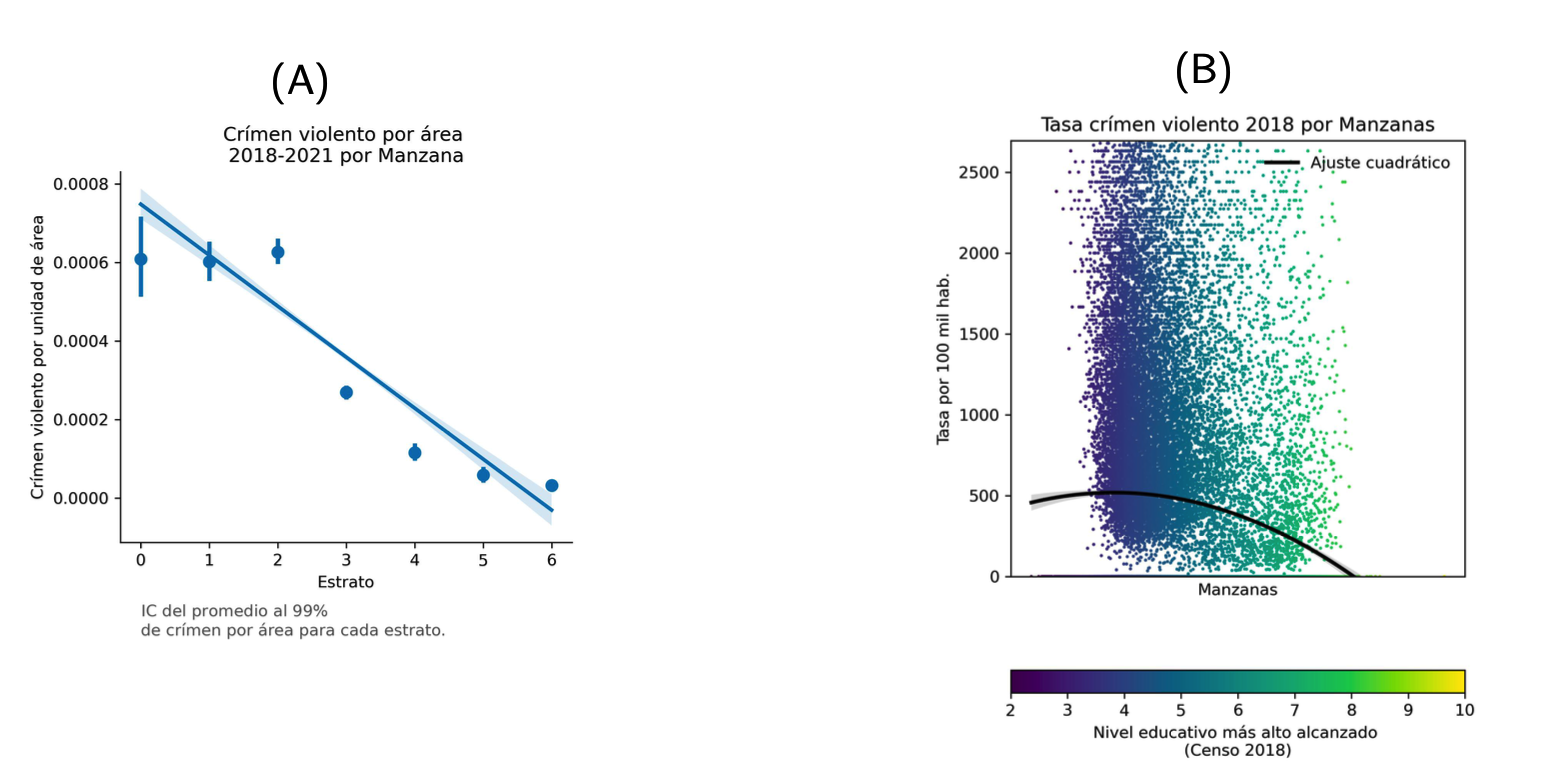
At the city block level crime points had to be joined to the block polygon closest to its centroids, given that most crimes are usually committed on the streets of the city, i.e. not inside a block. We used again the socioeconomic stratum as well as the mean of the highest education level achieved, a variable taken from the 2018 Census. The negative correlation between violent crime rate and block stratum is very clear in Figure 4A. This correlation is less obvious with maximum education level achieved (Figure 4B), but still identifiable. But with respect to crimes against private property, education level shows again a strong positive correlation with education level achieved.
